13
The Importance of Infographics
In this day and age, we are constantly flooded with information, so much so that sometimes it’s hard to process everything we see online. Infographics are becoming an increasingly popular way to display information on social media. An infographic is the visualization of data using design elements and colors to grab a viewer’s attention. When you only have a few seconds to make an impression, infographics can do just that successfully and in a memorable way.
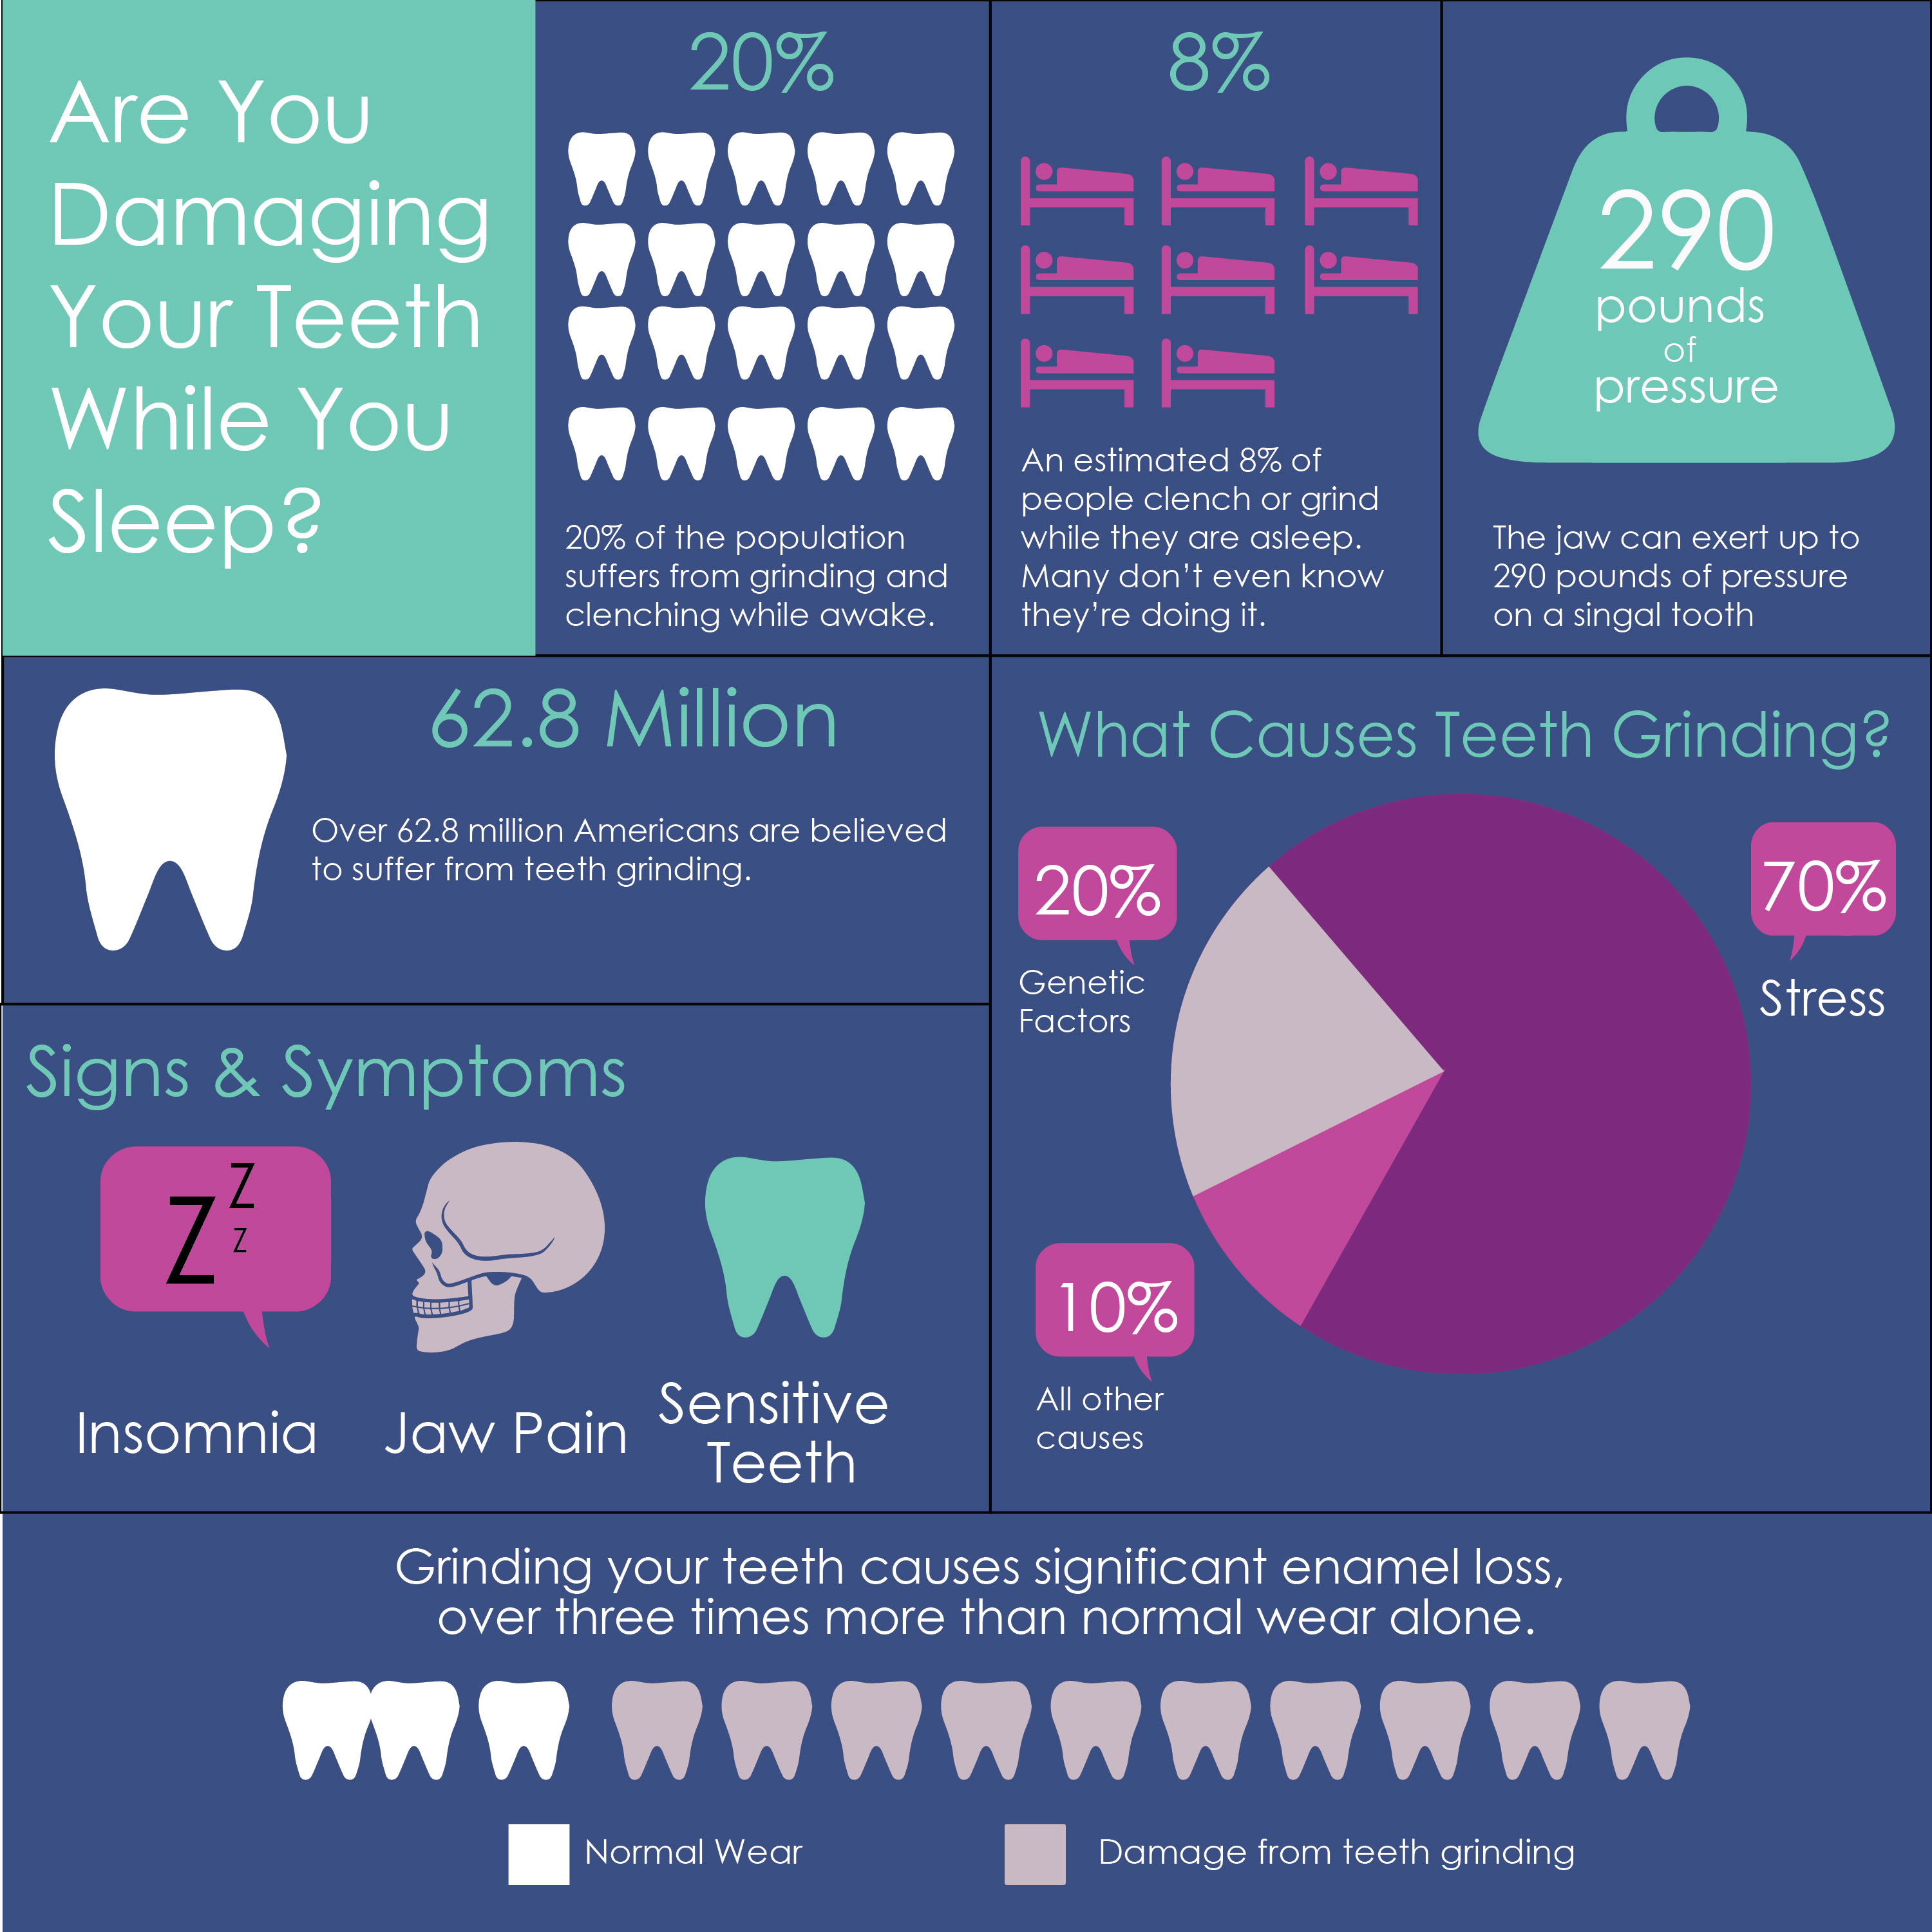
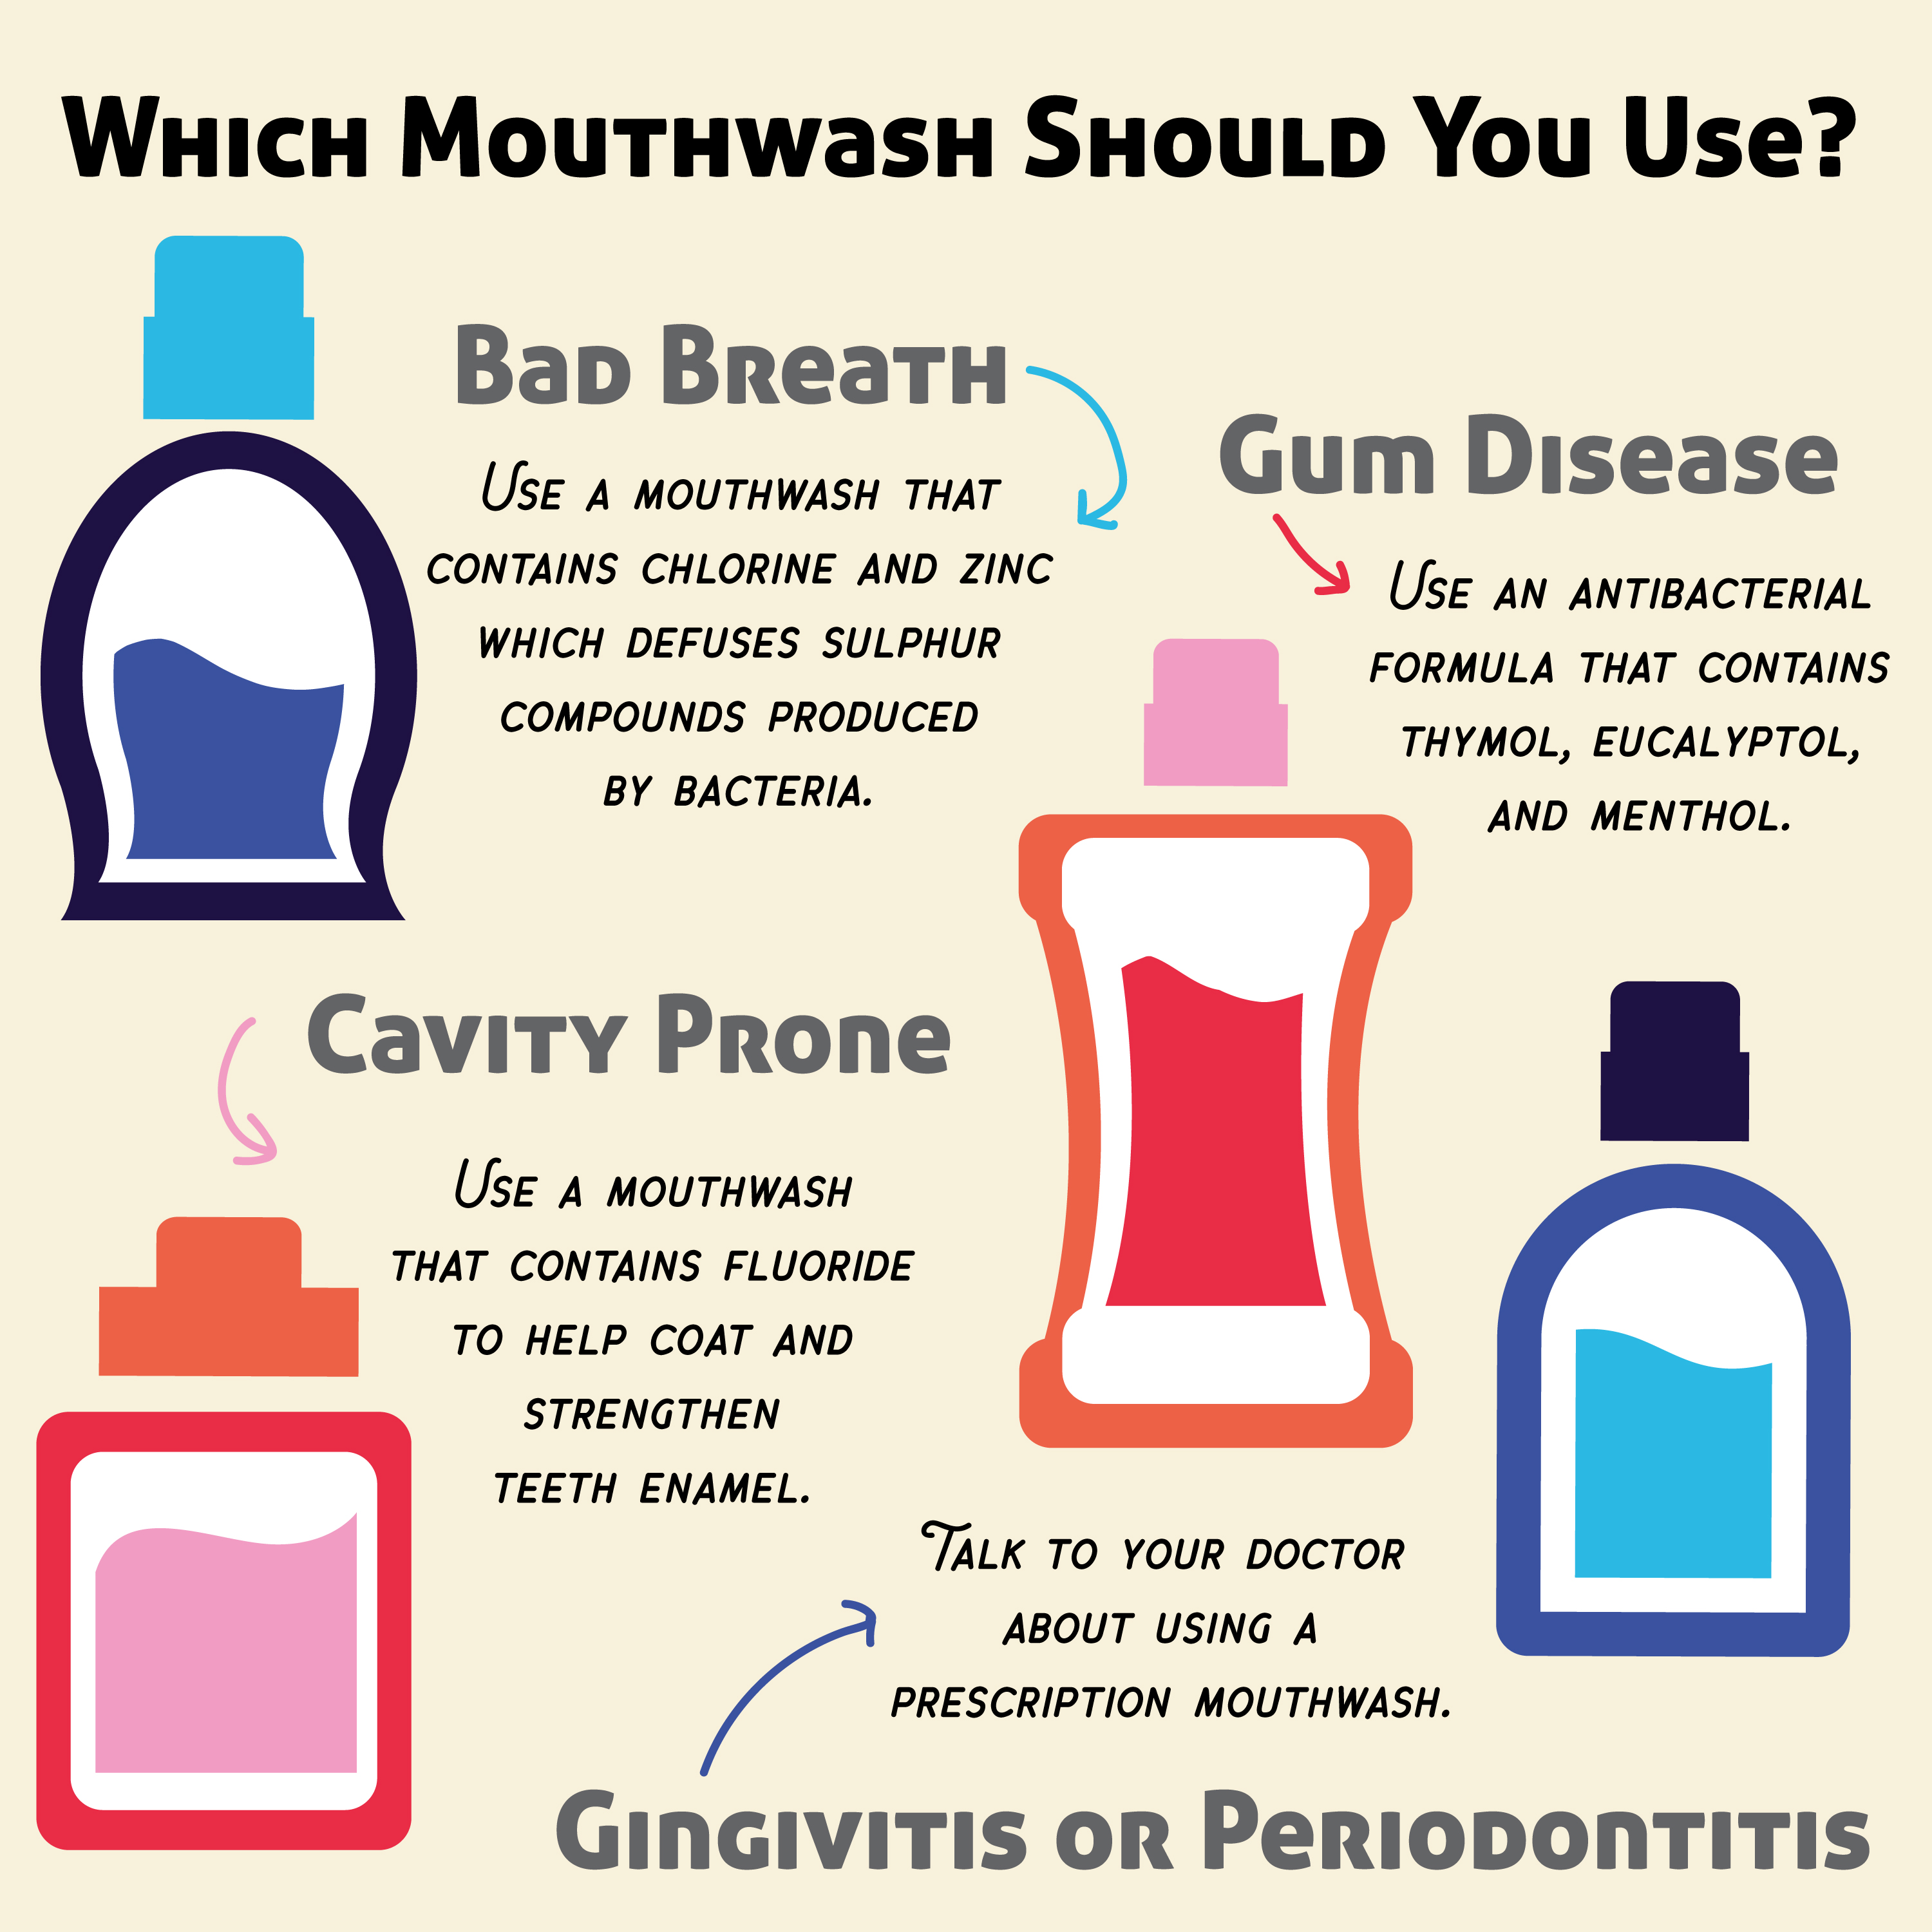
 At Sesame, we have seen great success by adding infographics to our member’s social posting schedules. For our intents and purposes, they can be especially useful when it comes to educating patients about health and dental related topics. While infographics can take many shapes and sizes, we tend to focus on what we like to call “mini-infographics”. These mini-infographics focus on a specific part of the subject at hand. Traditional infographics are jam-packed with data and require zooming in to read every detail. While these are useful, we’ve found they can be hard to read on social media, especially on a phone. We tend to keep our infographics straight to the point to help get a clear message across.
Social media is designed for easy access to content. While a blog post may take the reader a couple minutes to read, an infographic can communicate that same information in a matter of seconds. We live in a highly visual world and your followers are more likely to engage with content that is both easy to digest and pleasing to the eye. According to statistics, 41.5% of marketers believe that infographics are the best visuals for generating engagement. This is why adding infographics to your social stagey is highly recommended. However, as with other kinds of content, oversaturation can be a common problem when putting this strategy into action. Posting too many infographics can lessen their impact so we typically limit them to a few a month in order to keep them relevant and welcomed on your feed.


Want to request a specific kind of infographic? Feel free to respond to this blog and you just may see it on your upcoming posting schedule!
—Tyler Harris, Senior Social Media Specialist, Sesame Communications
Source: https://www.impactbnd.com/blog/visual-content-marketing-statistics-2017
